


 19 / 96

15
This was partly due to strong cash returns from our
hotel and residential property operations, as well as a
good boost from the increasing capital valuations on
property.
At balance date our total debt stood at 27.2 percent
of the total assets. TGH has since paid back a further
$100.5 million of debt, however this took place
following the period covered by this report.
Ngaa Hua Whaanui
Profit from Diverse Areas
It is pleasing how a range of the tribe’s investments
have contributed to the result over the past year.
Property investments recording underlying increases in
value, hotels returned good puutea, residential sections
sold well and new contracts were won by Go Bus.
Waikato Milking Systems has increased export sales to
balance the effect of a tough local market due to lower
milk prices. Shares owned in Genesis Energy were an
exception to an otherwise positive year, with the value
of the shares dipping by 8.5 percent by year’s end.
Ngaa Whakatau Tahua Ki Mua
Investment Decisions Ahead
TGH has many positive investment opportunities
ahead as we move toward a more diversified portfolio
in line with our role as Kaitiaki (guardian) of the
tribe’s commercial investments. The opportunities
in front of us include investing into shares to help
reduce risk, improve liquidity and move us to a more
balanced portfolio. Further possible developments or
acquisitions (depending on the availability of capital)
include the purchase of whenua, another hotel in
Taamaki Makaurau, Ruakura Inland Port, and exploring
future opportunities for developments on tribal
whenua at Huntly and Meremere.
TGH will be able to
secure more puutea, more
jobs and more whenua
for Waikato-Tainui by
holding a wider spread
of investments.
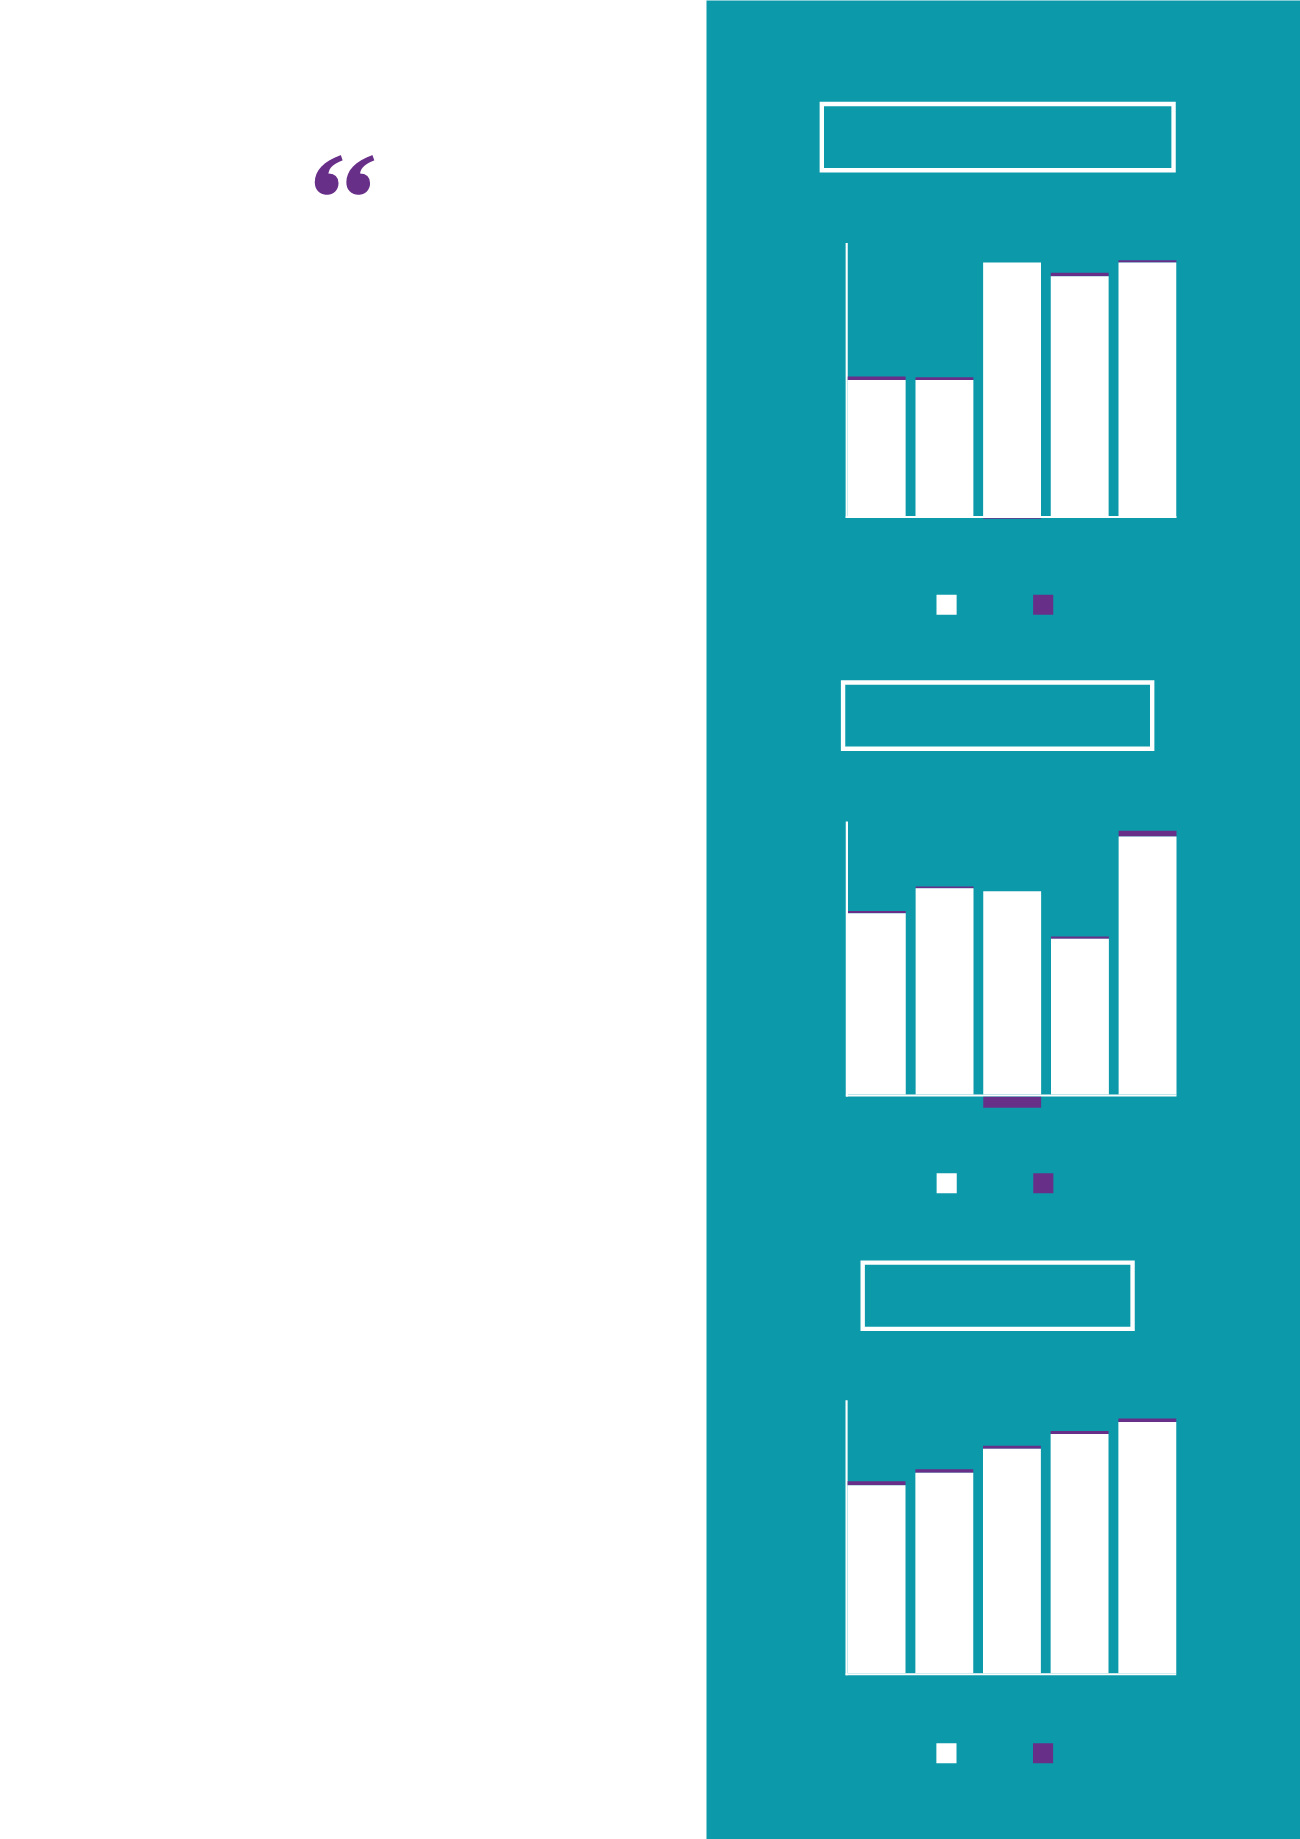
NET OPERATING PROFIT — TGH + WTF
0
5
15
20
25
2012 2013 2014 2015 2016
10
35
40
$M
TGH WTF
20 20
37
37
35
0.5 0.4
0.5
0.3
(0)
YEAR
NET PROFIT/(LOSS) — TGH + WTF
0
20
30
40
2012 2013 2014 2015 2016
10
50
60
$M
TGH WTF
39
45
44
34
56
0.5
0.4
1.2
0.5
(2.4)
YEAR
TOTAL ASSETS — TGH + WTF
0
200
400
600
800
1000
$M
2012 2013 2014 2015 2016
TGH WTF
14
13
11
11
12
680 725
812
865
909
YEAR